Key Performance Indicators
Setting New Milestones

Financial Highlights
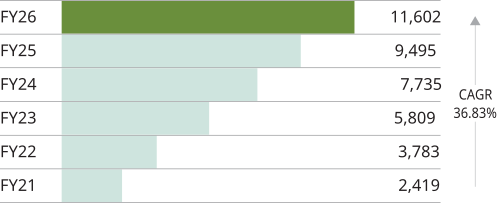
Revenue from Power Supply
(₹ crore)
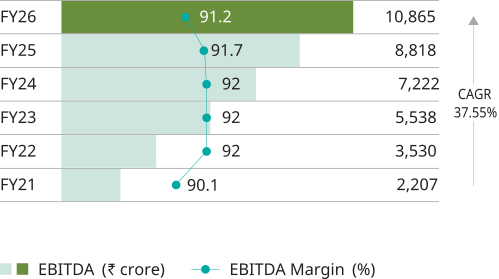
EBITDA and EBITDA Margin from Power Supply1
(₹ crore)
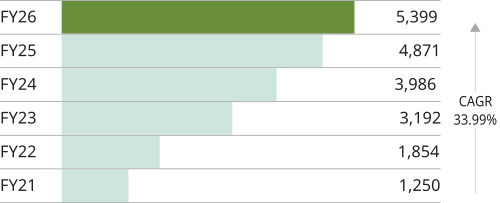
Cash Profit2
(₹ Crore)
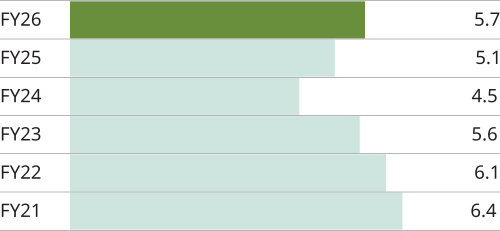
Net Debt/Run-rate EBITDA
(X)
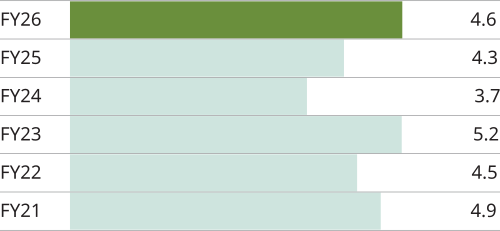
Net Operational Debt/Run-rate EBITDA
(X)
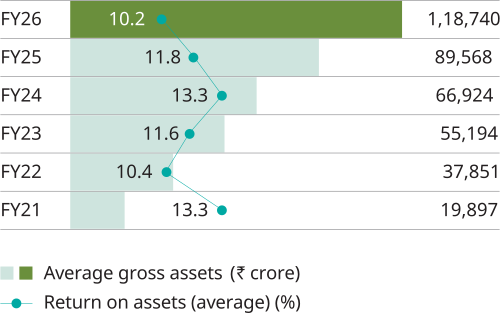
Rate of Return on Assets
Notes
- EBITDA from Power Supply: Revenue from Power Supply + Carbon credit income (part of Other Operating Income) + prompt payment discount - Employee Benefit Expenses excluding overseas expenses – Other Expenses excluding one-off expenses
- Cash Profit: PAT + Depreciation + Deferred Tax + Exceptional Items – other non-cash adjustments
Operational Highlights
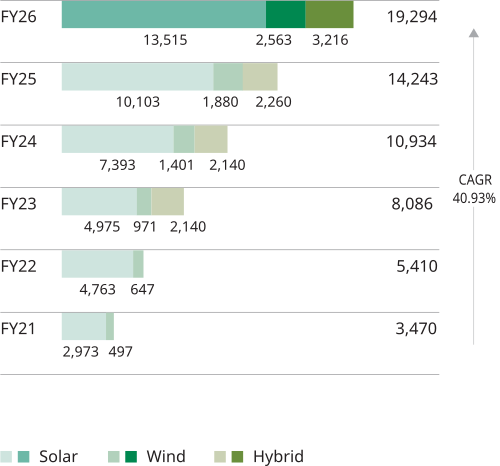
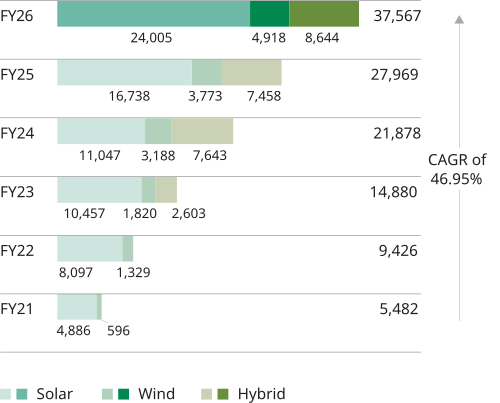
Operational Capacity
(MW AC)
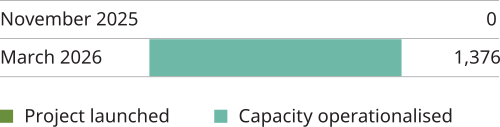
Operational Capacity – Battery Energy Storage System
(MWh)
Sale of Energy
(million units)
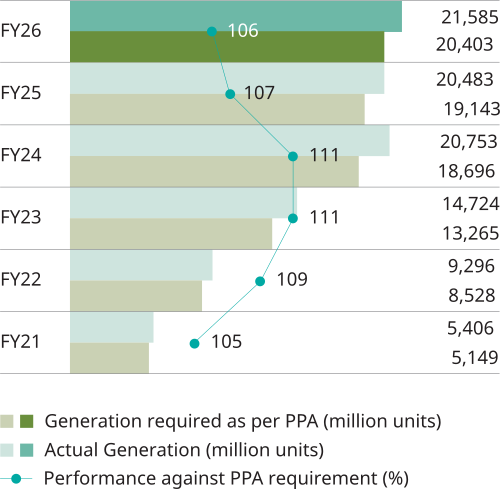
Energy Generation for PPA-based Operational Capacity
Commitment v/s Actual Generation (million units)
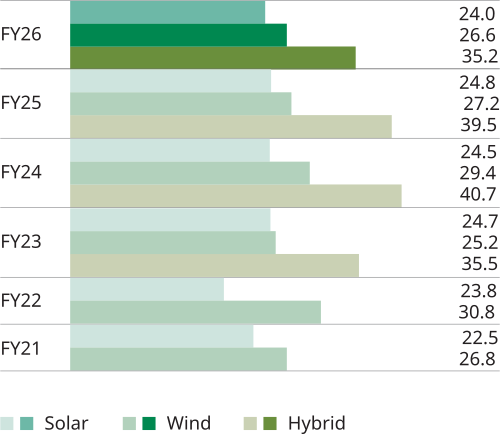
Capacity Utilisation Factor
(%)
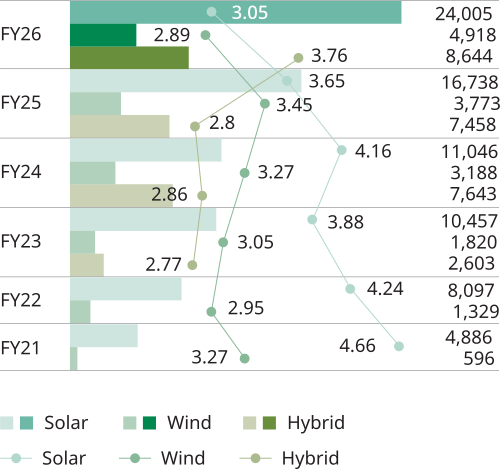
Volume and Average Realisation
(%)