
Business Model
Value Creation Model
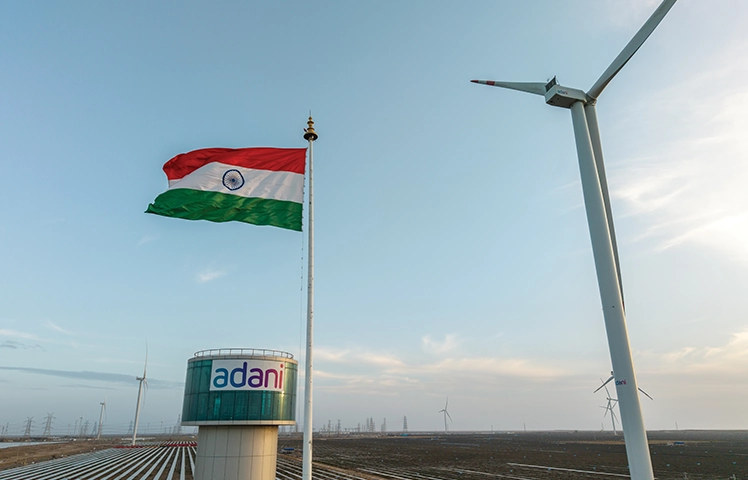
Khavda, Gujarat

Financial Capital
- ₹ 1,647 crore in equity
- ₹ 1,00,163 crore in debt (including suppliers credit)
- ₹ 8,912 crore cash and cash equivalents (inclusive of Margin money etc.)

Manufactured Capital
- 19,294 MW operational portfolio (13,515 MW solar, 2,563 MW wind and 3,216 MW hybrid)
- 1,376 MWh BESS (on despatchable basis)

Intellectual Capital
- Centralised cloud-based platform – Energy Network Operation Centre (ENOC)
- Analytics and AI/ML powered O&M enabling real-time data availability

Human Capital
- 976 total employees
- 35 average training hours per FTE in FY 2025-26
- ₹ 150 crore spent on total employee benefits

Social and Relationship Capital
- Strategic partnerships with TotalEnergies, a multi-energy company
- ₹ 47.39 crore CSR spending
- 2,680 suppliers

Natural Capital
- Deployed 71.5% robotic cleaning technology in solar portfolio to save water
- Conducted ESIA study for 100% projects in planning stage
- Integrating ESG aspects starting from site selection to maintain ecological balance
Financial Capital
- Diversified equity and debt funding pools supported by a strong balance sheet and disciplined capital management
- Construction framework with international and domestic lenders for fully funded growth
- Non-fund-based credit lines of USD 1.2 billion to support the short-term funds
Manufactured Capital
- Presence in 12 resource-rich states with strong RE potential
- Expertise in developing GW-scale RE projects
- Supply chain and evacuation planning in sync with project timelines
- Robotics technology deployed for solar module installation
- ~2.5 lakh acres of construction-ready land banks
- Low per-MW capital and operating cost backed by economies of scale
- 100% must run portfolio
Intellectual Capital
- In-house analytics and operations capabilities
- Extensive weather database and statistical models support long-term resource forecasting
Human Capital
- Large scale workforce skilling ensures sustained mobilisation across project sites
- Digital tools to empower employees
Social and Relationship Capital
- Extensive local supply chain ensures reliable supplies and local support
- Local infrastructure development and job creation ensure social acceptance and project continuity
Natural Capital
- Access to high-quality solar and wind resources across multiple geographies
- Resource-efficient project design supported by advanced technologies ensures sustained, responsible access to natural resources

Environment and Climate

Socio-economic Factors

Community

Other Stakeholders

Government
 37,567 million units
Power generated
 26.67 Mn tCO2e
Emissions avoided
Financial Capital
- ₹ 11,602 crore revenue from power supply
- Industry-leading EBITDA margin of 91.2%
- ₹ 5,399 crore cash profit
- 5.7 net debt to run-rate EBITDA
Manufactured Capital
- 5,051 MW new capacity added
- 24.0% CUF for Solar, 26.6% Wind and 35.2% Solar-Wind Hybrid
Intellectual Capital
- 99.2%, 95.6% and 98.5% plant availability for solar, wind and hybrid projects respectively, through continuous monitoring
- Improved operational performance, seamless information flow and decision-making
Human Capital
- ₹ 11.89 crore revenue per employee
- Zero Employee fatality
- 8,54,832 continuous safe person-hours
Social and Relationship Capital
- 2,77,193 lives touched through social programmes
- 41% marginal and vulnerable beneficiaries
- 100% critical and important manufacturing suppliers evaluated on ESG parameters
Natural Capital
- 99.7% less operational emission intensity per unit of generation than the Indian grid average
- 99.6% less operational freshwater consumption per unit of generation than the statutory limit for thermal power
- 7,90,764.41 KL water saved through robotic cleaning
- 100% operating capacity Net Water Positive
- Zero waste to landfill (ZWL) and Single-Use-Plastic (SUP)-free operations
Financial Capital
- Focus on merchant, commercial and industrial (C&I), contract for difference (CFD) and mid-duration hybrid opportunities
- Cost optimisation through scale efficiencies and technology-led interventions
Manufactured Capital
- Leverage advanced technologies and standardised design and construction practices to reduce cost per MW and execution timelines
- Capex of ₹ 30,365 crore and maintain execution speed
- Coordinate with stakeholders to align project execution with grid-readiness
Intellectual Capital
- Deepen AI and analytics capabilities
- Institutionalise learnings from existing large-scale operations
Human Capital
- Align capability development with evolving RE technologies
Social and Relationship Capital
- Enhance the lives of people in the site vicinity (job opportunities, education, healthcare and community infrastructure)
- Deepen relationship with strategic vendors and maintain ESG evaluation to build resilient, responsible supply chains
Natural Capital
- Enhance EV fleet to reduce emissions
- Progress towards no net loss of biodiversity
- Ensure water positive, ZWL and SUP-free status across all-new sites